The Q3 2022 benchmarking report for UK high street fashion brands has just been published. Learn how the top 12 UK high street fashion brands perform across the digital space.
The latest Q3 2022 benchmarking report for UK High street fashion brands has just been published. It covers the largest 12 national high street fashion brands, including Monsoon, River Island, Superdry, Oasis, White Stuff, H&M, New Look, Matalan, Next, Zara, Fat Face and Joules.
The research gives an inside track on who is winning the biggest share of voice online, and quantifies the gaps, risks and missed opportunities for other high street fashion brands to win brand exposure locally, in-store footfall and online orders. The report highlights quick wins that will improve enquiries from your online strategy and identifies the barriers that may be reducing your site’s ability to optimise digital performance.
To see a preview and contents page of the Q3 report, click here. To get a copy of the full report and the key take-aways, please complete the enquiry form or schedule a call. 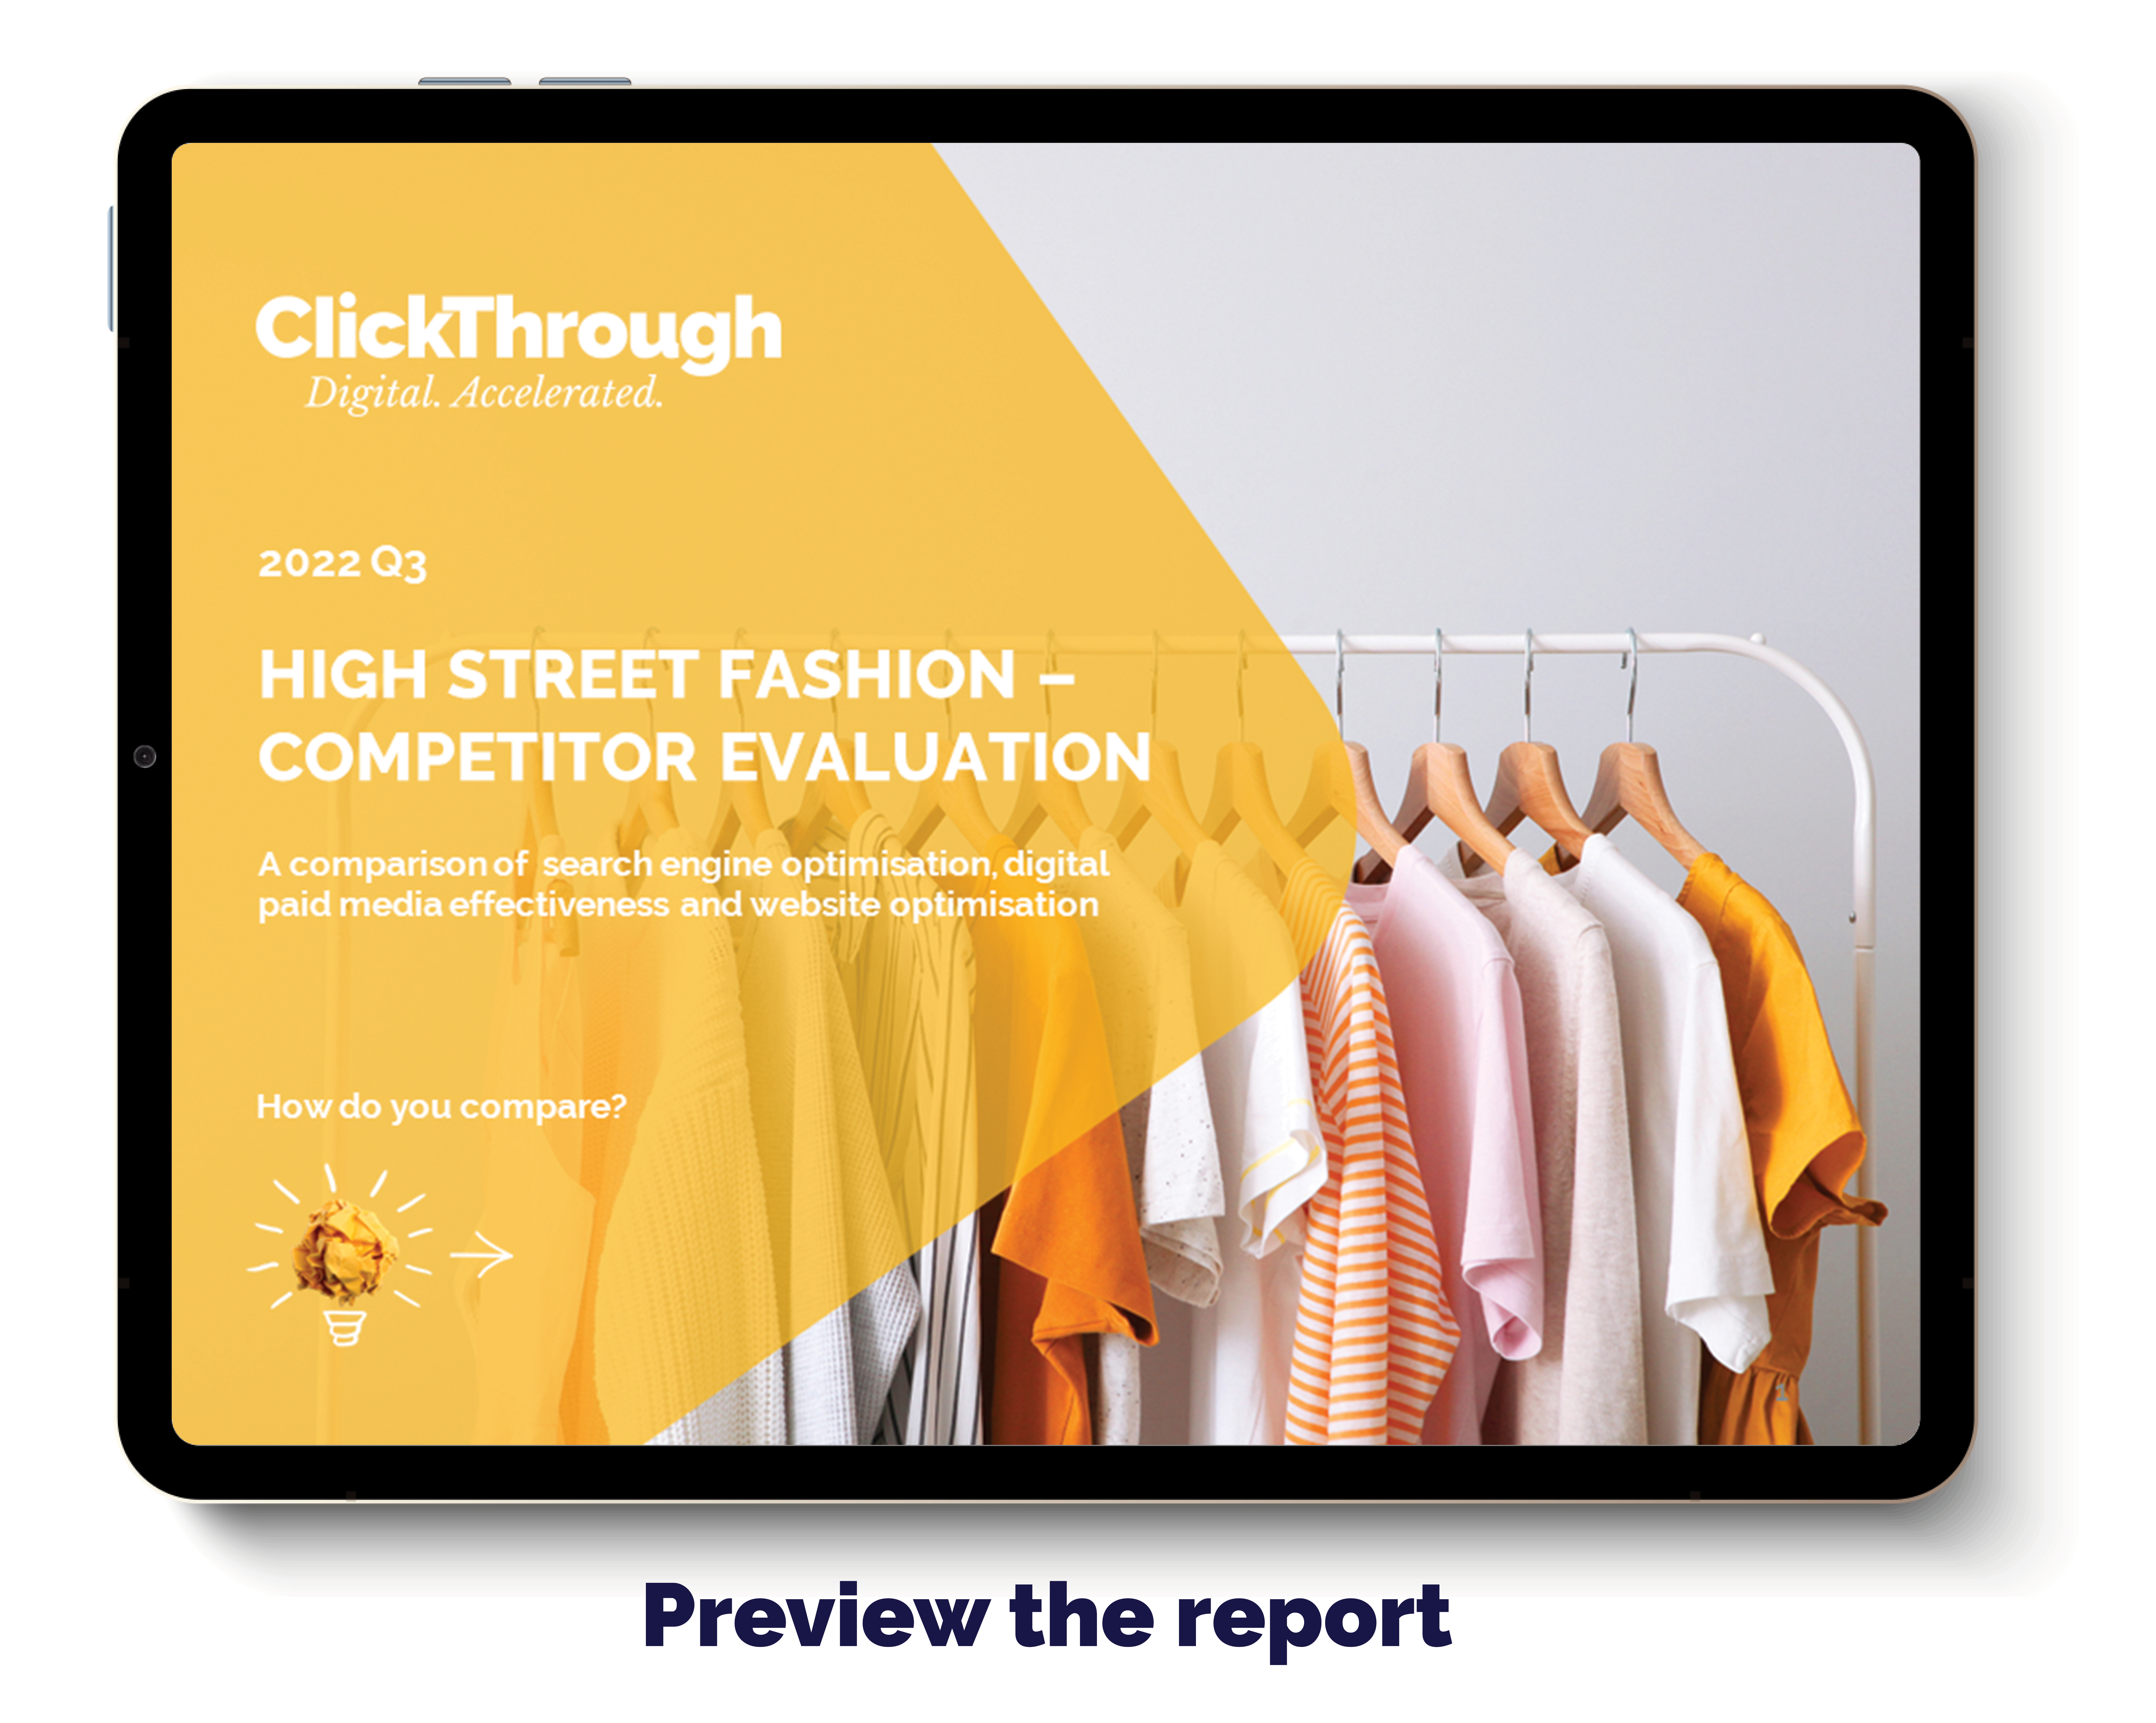
You can also find out how these 12 high street fashion brands performed against last quarter, by revisiting our Q2 report round-up.
What The Industry Research Report Covers
The 70+ pages of research benchmarks each retailer based on 50+ metrics and indicators of successful digital strategy, including organic visibility, domain authority, paid media ads, conversion performance, technical performance, site speed, universal search, content, social ads, accessibility, and mobile performance.
Driving Optimal ROAS from Paid Media Channels
Some of the leading players in the space are high spenders on paid media channels such as Google, Bing & Facebook - but have a poor or sub-optimal conversion improvement strategy. Without an optimised, sophisticated conversion strategy that maximises the conversion rate, the return on investment is unsustainable or will under-perform. Scaling spend on paid media is not achievable unless the conversion rate delivers optimal performance in the sector. Some in the space have paid media spend levels from 30k+ per month but dedicate minimal resources and budgets to conversion testing. Given the cost per clicks on ad networks will continue to rise, we recommend spending at least 10% of your paid media budget on ongoing conversion optimisation testing schedules to ensure your paid media ROI maintains long term viability, competitive advantage, and sustainability.
Technical Website Compliance
Savvy digital marketers know that having a technically sound website is an essential component of a successful fully integrated digital strategy - plus a site capable of maximising conversion performance.
Many of the UK high street fashion brands have varying degrees of technical errors that will be hindering organic traffic and conversion performance. An example here is Joules’ 2,549 4XX errors. We saw in Q2 New Look had the highest number of errors with 7,945 4xx errors, however this looks to have got much better within the last quarter, with New Look managing to get down to 172 4xx errors. All companies seeing errors need to continue looking into the causes, as these will be making their site difficult to navigate and frustrating to use. This is likely to also give a negative impression of the brand to the user, who need to trust them to provide an excellent level of service.
Site Speed & Conversion Rate Performance
When 62% of consumers are less likely to convert if they have a negative mobile site experience, ensuring that your site is quick and easy to load makes a significant improvement on your overall conversion rates.
In our research in Q2, we discovered that only two of the UK’s high street fashion brands were achieving even an ‘ok’ mobile page speed score, of between 50-89, however since then it has dropped to only one. Matalan, although still in the ok category with 53, have dropped from their score of 79 in Q2. White Stuff are still behind on a score of only 1.
Building Competitive Advantage with Domain Authority
Domain authority is an essential metric for measuring the effectiveness of SEO performance, and helps create a reliable overall gage of how effective your site is at achieving organic traffic, i.e. ‘free’ traffic that isn’t gained through sponsored ads.
A ‘good’ DA really comes down to how your competitors are performing, however it’s generally considered average between 40 and 50, good between 50 and 60, and excellent above 60. All twelve of the companies achieved a score of excellent with the DA range from 87 to 61. Whilst these are great results across the board, those at the lower end of the scale need to be focusing on building a stronger backlink profile to compete with the higher scoring providers. We can see compared to Q2 that both ends of the spectrum have dropped in score. Matalan were on 89 in Q2, while White Stuff were on 62, now on 87 and 61, respectively.
Organic Performance – Mobile & Desktop
A strong organic performance is strategically important as it ensures your site ranks above competitors for key, transactional keywords. When 93% of your customers won’t go past the first page of Google, your absence or lack of targeting for essential keywords will cost you conversions.
We looked at how all twelve high street fashion brands have performed compared to last year. Continuous improvement and optimisation is also needed to secure traffic year on year. We discovered that only three of the high street fashion brands in our report have gained organic mobile traffic year on year putting the other two providers in danger of losing organic customers to their competition. Next saw the biggest loss with a 45% drop, with Joules not far behind on a 38% loss.
Universal Search Opportunity
Google Universal Search Results is an evolving opportunity to make your pages visible on a SERP (Search Engine Results Page). Universal results often appear before traditional listings and are eye-catching for users. Universal search results refer to rankings on a SERP that are not the traditional ‘blue line’ Google link, and a retailer can appear for universal search results without being strong in standard rankings.
We could see that Image Pack was the highest used universal search feature, with Next taking the top spot reaching 186,800 results, gaining a huge 62,100 in the last quarter. Most companies are underusing most universal search feature options, with some companies only seeing a handful of results. Those getting a small amount of results need to work towards the numbers their competitors are achieving.
The Longtail Keyword Opportunity
Longtail keywords are often considered high intent and potentially more likely to convert as a searcher is being more specific. Optimising for longtail keywords also puts your content strategy in a strong position to rank for retailer new search terms as they enter Google’s index.
Oasis are still ranking for no longtail keywords within the top 3, as we also pointed out in Q2. They should be looking at how to improve their rankings on existing longtail keywords, but also at how they can expand their strategy to include new specific search terms.
Facebook Adverts
With the number of Facebook users in the United Kingdom (UK) forecast to hit over 42 million users by 2022, it is not surprising that companies have jumped at the opportunity to advertise on the social media platform. Facebook’s UK digital advertising revenue has been estimated to have breached 2.6b GB pounds in 2019.
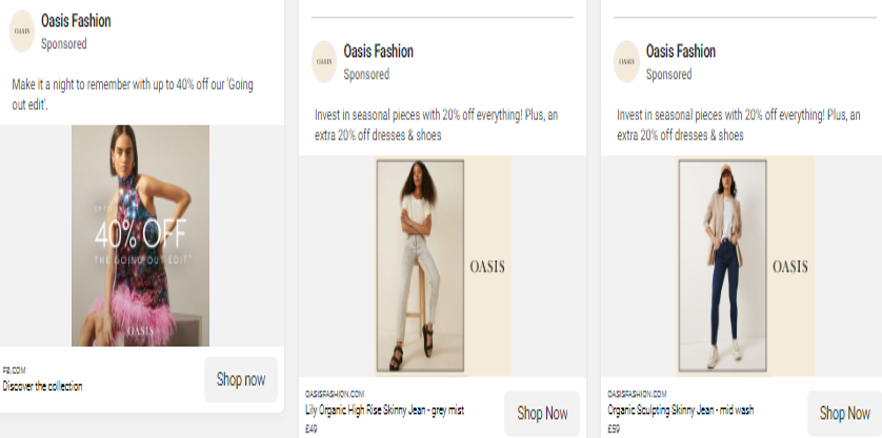
Below, we can see examples of Oasis’ Facebook ads. The use of images of their recognizable brand colours, along with deals and clear CTA’s, make the advert both sleek and eye catching.
Top Social Shares & Content
When it comes to social media and on-site content strategies, it is important to release content that has a longer shelf life. An article is considered 'Evergreen' if it has maintained its relevancy to an audience for longer. It's great for your retailer engagement, but great for Google too, who will recognise content which achieves traffic over a long period of time.
We saw in our research that many of the high street fashion brands are falling behind on content creation. Superdry have been sharing very little content over most of 2022 compared to their competitors, as we pointed out in Q2. We can however see Monsoon have picked up their content compared to the last quarter. For high street fashion brands with different products, styles and deals, they could all definitely find more content to share on their social platforms.
Website Readability & Accessibility
20% of people in the UK have a disability – 2 million of which are people living with sight loss. In addition, 1 in 12 men and 1 in 200 women have some degree of colour vision deficiency. When websites are not designed to meet these needs, retailers lose customer interest as they turn elsewhere.
Most of the high street fashion brands appear to be struggling with accessibility within their sites, with all twelve seeing an array of errors, contrast errors and alerts. In Q2 we saw Joules were reporting the highest number of alerts, hitting a huge 1,023. In Q3 they have even more, with 1,164 alerts. Joules need to look into the cause of these alerts. All twelve high street fashion brands should always be reviewing and optimising their accessibility.
User journeys & conversion rate performance
3.42 seconds are all it takes for a user to judge a site solely on its appearance. For sites with a low clarity score, this means users are getting a poor impression of your brand and aren’t seeing your vital cues to convert.
In our research we saw that River Island was on top with a score of 92, which is an improvement to their Q2 score of 90. However, White Stuff were scoring 92 in Q2 but have dropped to 81. White Stuff need to be investigating this to see the cause of the drop in clarity score.
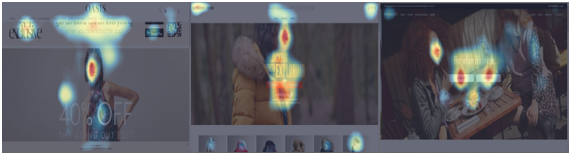
Additionally, we use attention maps to judge user behaviour and assess how customers are interacting with a site. You can see from these examples just how wildly different site designs can impact user attention;
Q3 2022 Winners leaderboard
For a glance into just 6 of the metrics we evaluated these top 12 high street fashion brands on, check out our quick-look table below; 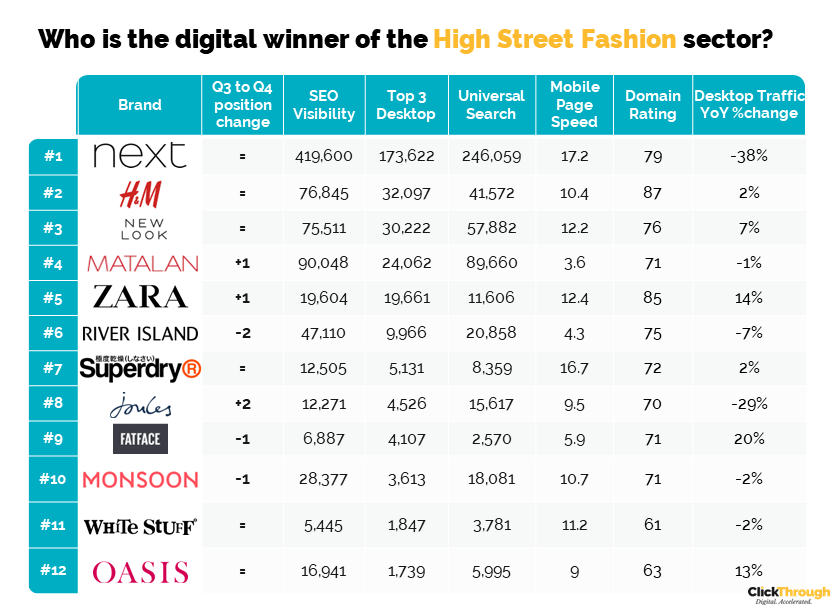
We can see that the top 3 and bottom 2 spots haven't changed since Q2, whilst most of the middle section has changed around. Joules have seen the biggest jump, going from #8 to #6, whilst River Island saw the biggest drop, going from #6 to #8. To see the Q2 report and leaderboard, click here.
GET THE FULL 70-PAGE Q3 2022 REPORT
To get a copy of the full report, please complete the enquiry form. If you want to talk to us about accelerating your digital performance, please call us on 01543 410014 or schedule a call with Mike Movassaghi.
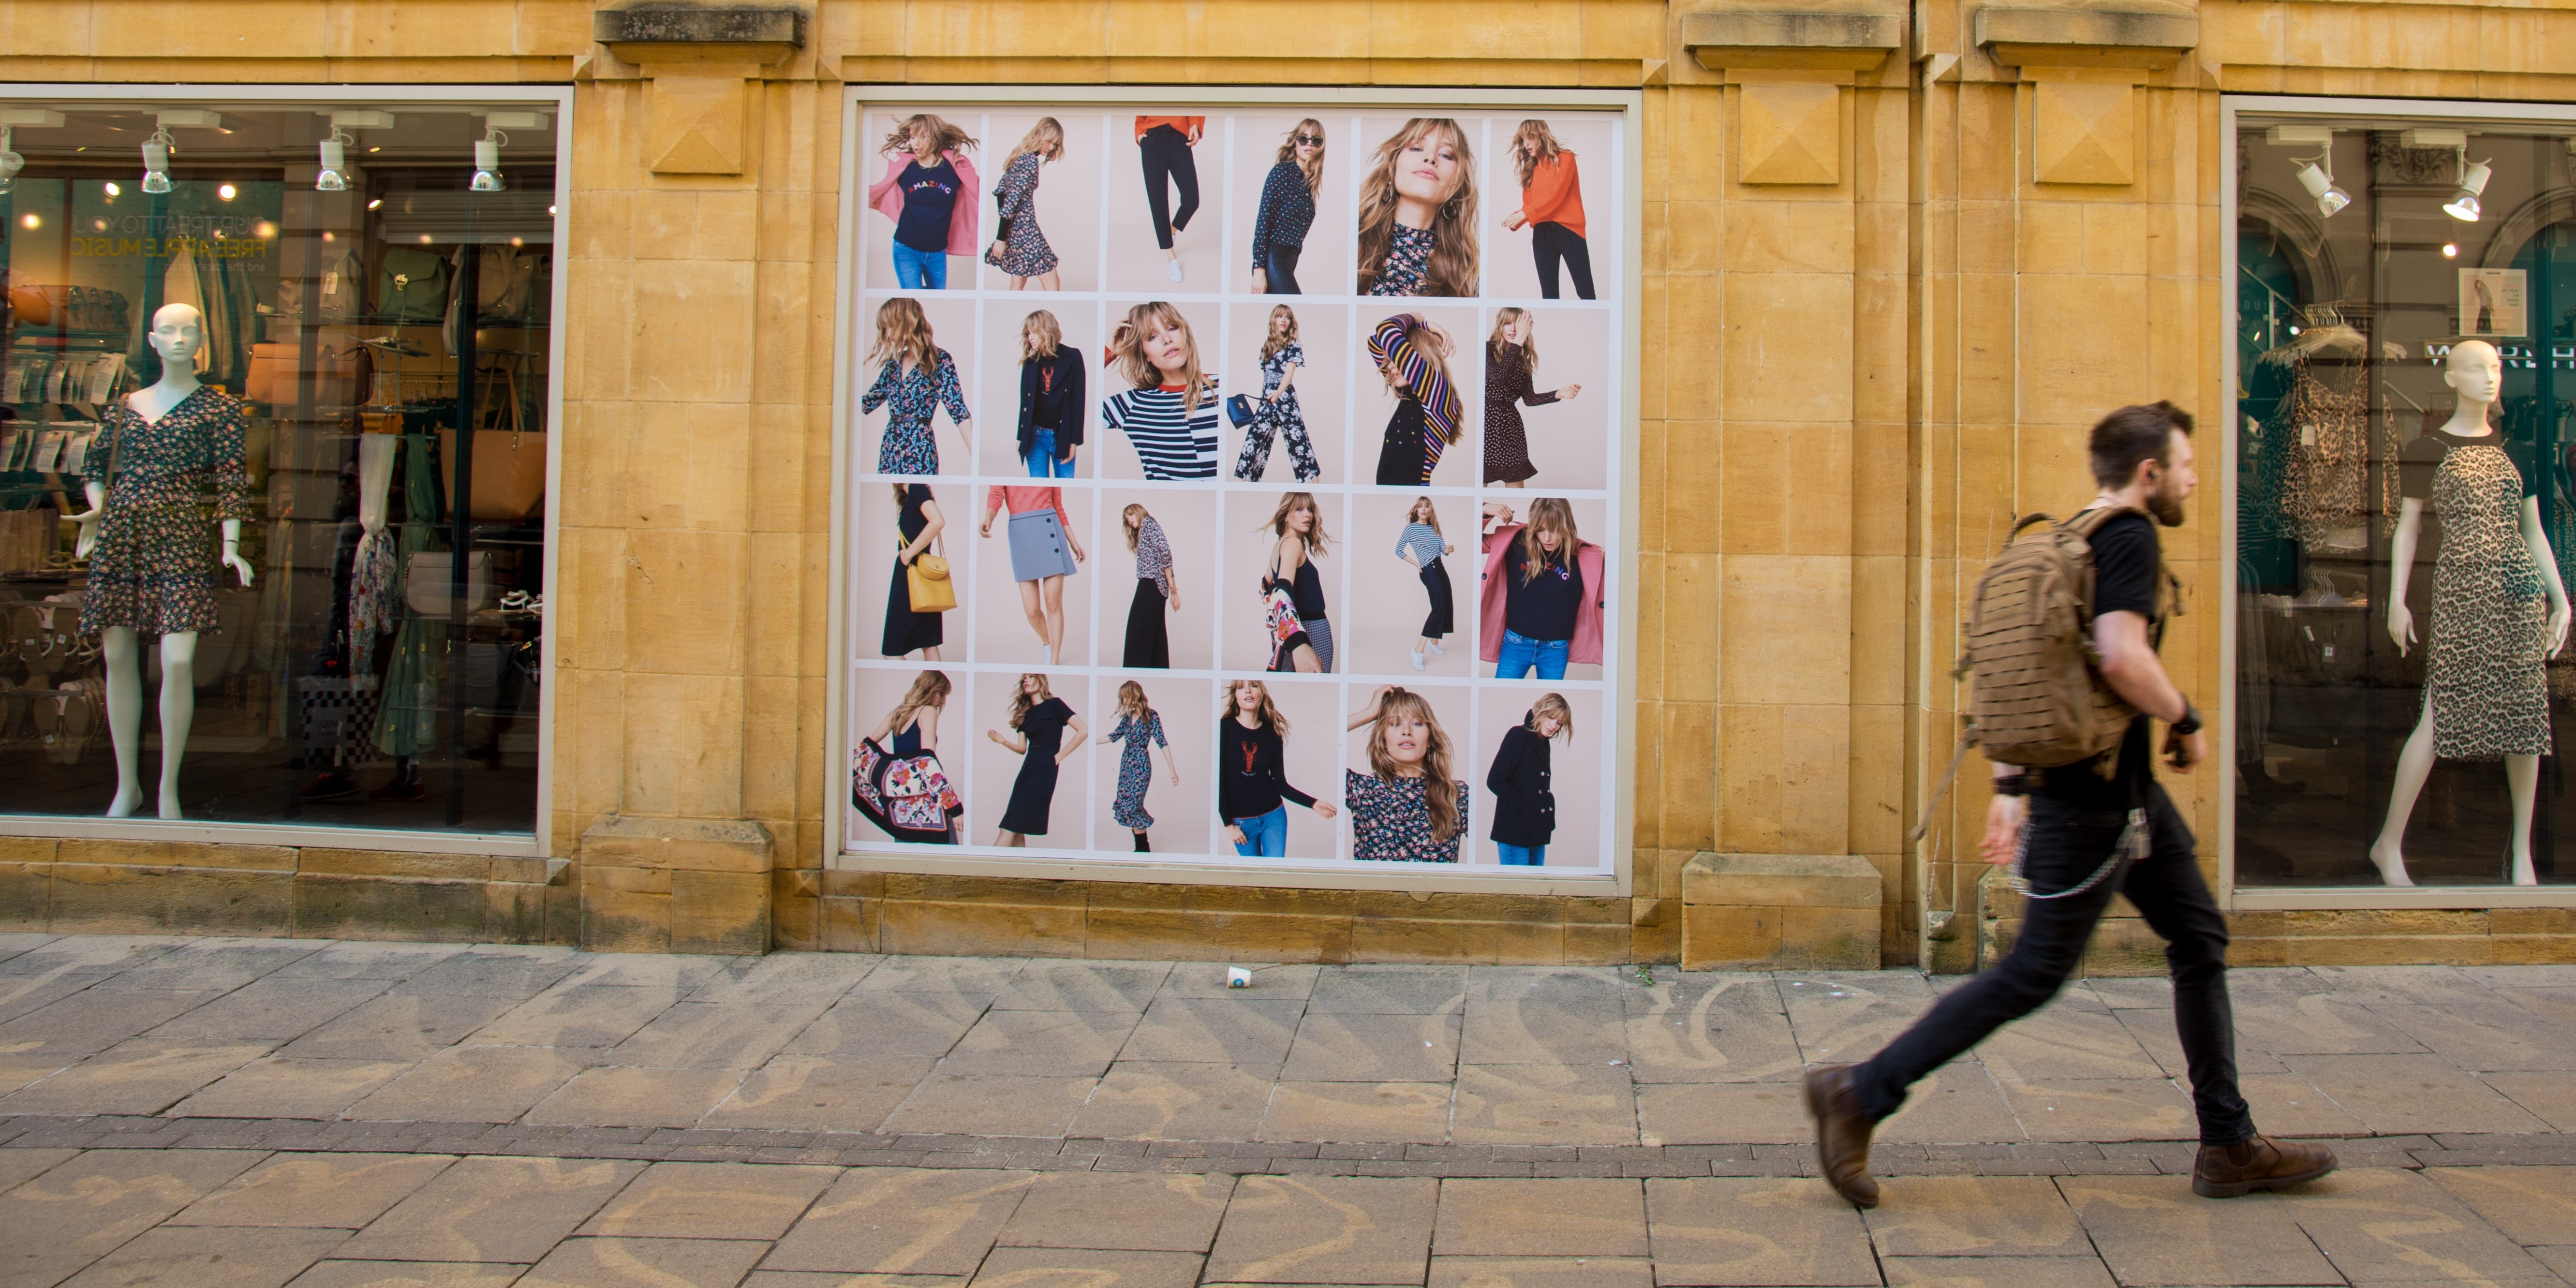
Photo by Richard Bell on Unsplash