

The Q1 2026 benchmarking report for UK kitchen and cookware brands has just been published. Learn how the top 11 UK cookware brands perform across the digital space.
The latest Q1 2026 benchmarking report for UK kitchen and cookware brands has just been published. It covers the largest 11 national kitchen and cookware brands, including ProCook, Portmeirion, Circulon, Denby Pottery Company, Hexclad Cookware, Salter, Our Place, Le Creuset, Tefal, Stellar Global Ltd, and Grunwerg - it highlights year-on-year digital performance, plus winner and loser comparisons in 20+ online performance metrics.
The research gives an inside track on who is winning the biggest share of voice online and quantifies the gaps, risks and missed opportunities for other kitchen brands to win brand exposure, generate online orders, and drive in-store interest & recognition. The report highlights quick wins that will improve enquiries from your online strategy and identifies the barriers that may be reducing your site’s ability to optimise digital performance.
To see a preview and contents page of the Q1 report, click here. To get a copy of the full report and the key takeaways, please complete the enquiry form or schedule a call.
Q1 2026 Winners and Losers Summary
For a glance into just 6 of the metrics we evaluated these top 11 kitchen and cookware brands on, check out our quick-look table below;
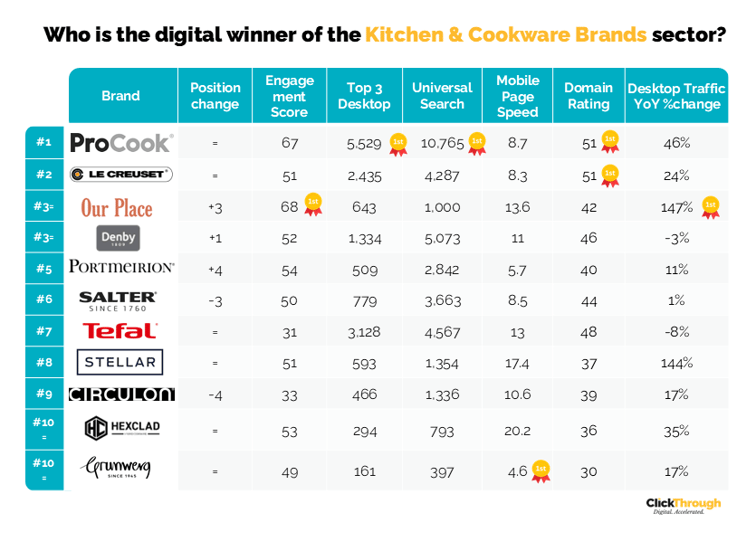
Continue reading for further detail on this quarter's best and poorest-performing kitchen and cookware brands or request a copy of the report for the full review.
What The Industry Research Report Covers
The 70+ pages of research benchmarks each brand based on 50+ metrics and indicators of successful digital strategy, including organic visibility, domain authority, paid media ads, conversion performance, technical performance, site speed, universal search, content, social ads, accessibility, and mobile performance.
Driving Optimal ROAS from Paid Media Channels
Some of the leading players in the space are high spenders on paid media channels such as Google, Bing & Facebook - but have a poor or sub-optimal conversion improvement strategy. Without an optimised, sophisticated conversion strategy that maximises the conversion rate, the return on investment is unsustainable or will underperform. Scaling spend on paid media is not achievable unless the conversion rate delivers optimal performance in the sector. Some in the space have paid media spend levels from 30k+ per month but dedicate minimal resources and budgets to conversion testing. Given the cost per clicks on ad networks will continue to rise, we recommend spending at least 10% of your paid media budget on ongoing conversion optimisation testing schedules to ensure your paid media ROI maintains long-term viability, competitive advantage, and sustainability.
Pay-Per-Click Marketing
Pay-Per-Click marketing is constantly evolving, with more and more advertisers being forced to hand over a lot of control to Google's algorithms as the push for automation grows ever stronger. There are still key elements of control that we have though, the main one of these being budget which is ultimately something the algorithms can't take from you. That's why being smart with your budget and ad coverage is essential to achieving strong results and bettering what your competitors have to offer.
For Q1 2026, the average monthly budget wastage across these UK kitchen and cookware brands was £5,306, with some of the top players in the market spending a considerable amount on areas and audiences unlikely to deliver a return. We can see this in more detail when looking at the average monthly cost per cost-per-click (CPC) amongst advertisers, with the average of this metric being £15 . This highlights how competitive the market is and how important it is to control your budgets effectively.
There are varying monthly ad budgets across the competitors in the report. While this gap highlights the competitive advantage that larger budgets can provide, it's not just about spending more; it’s about spending smarter. By focusing on driving efficiency in campaign management, targeting, and budget allocation, businesses with smaller budgets can still effectively compete with larger players. Investing in data-driven strategies and refining ad performance can help close the gap and maximise the return on every pound spent, enabling growth even in a competitive landscape. Relative to their spend, both Salter and Denby Pottery Company reported the lowest monthly cost-per-click (CPC) at £4, and Le Creuset has the highest at £59.
The report highlights the importance of budget efficiency by comparing monthly ad spend with estimated CPC in relation to your competitors, see who has the highest and lowest CPC. To maximise the effectiveness of your budget, it’s essential to focus on driving CPC down while maintaining or improving campaign performance. In this report, Le Creuset has the lowest estimate monthly ad spend at £1,360, and ProCook has the highest at £122,000.
By optimising targeting, refining ad copy, and leveraging data to identify high-converting opportunities, you can ensure every click delivers maximum value. This approach not only stretches your budget further but also boosts your return on ad spend (ROAS), enabling you to achieve stronger results without simply increasing expenditure.
Technical Website Compliance
Savvy digital marketers know that having a technically sound website is an essential component of a successful fully integrated digital strategy - plus a site capable of maximising conversion performance. For kitchen and cookware brands, particularly those aiming to offer a luxury cooking experience, a high-performing, easy-to-navigate website is essential for instilling consumer confidence, and ensuring that potential customers can find the products they are looking for.
In our previous audit, Denby Pottery Company received the most 404 errors (360). This quarter, Denby Pottery Company remains the brand to watch, and they’ve since increased their 404 errors to a total of 786. 404 errors represent a failure to meet user expectations. Visitors expect smooth, reliable access to content, and anything that blocks that access reflects poorly on the website. By reducing 404 errors and handling them thoughtfully when they occur, websites can create a more positive and trustworthy experience for their visitors.
Site Speed & Conversion Rate Performance
When 62% of consumers are less likely to convert if they have a negative mobile site experience, ensuring that your site is quick and easy to load makes a significant improvement on your overall conversion rates. For sites such as kitchen and cookware brands, who are juggling a wide range of products and may feel the pressure to make items stand out, high-resolution images and content can hold back performance when it comes to site speed.
In our last audit, Tefal received the slowest mobile site speed (19). This quarter, Tefal has increased their mobile site speed to 25, no longer making them the brand to watch. Currently, the mobile site speed ranges between 38 and 13, with Grunwerg reporting the slowest score. For many users, a slow-loading mobile site feels like a waste of time and data. Visitors may be relying on mobile networks rather than Wi-Fi, and slow performance can increase data usage unnecessarily. This can create a sense that the website is inefficient or inconsiderate of the user’s circumstances.
Building Competitive Advantage with Domain Authority
Domain authority is an essential metric for measuring the effectiveness of SEO performance, and helps create a reliable overall gauge of how effective your site is at achieving organic traffic, ie. ‘free’ traffic that isn’t gained through sponsored ads. For kitchen and cookware brands, collaborations with online culinary publications, homeware suppliers, or even bloggers in their niche could be a great way to boost these figures.
A ‘good’ DA really comes down to how your competitors are performing, however it is generally considered average between 40 and 50, good between 50 and 60, and excellent above 60. In our last audit, Grunwerg reported the lowest DA score (24). This quarter, Grunwerg remains the brand with the lowest DA, though they’ve since increased their score to 30. Building a consistent and recognisable brand presence also supports domain authority growth. When users search for a brand by name, mention it online or share its content, it reinforces trust and relevance. Brand mentions, even without direct links, can contribute to perceived authority. A strong brand identity helps a website stand out in competitive search results.
Organic Performance – Mobile & Desktop
A strong organic performance is strategically important as it ensures your site ranks above competitors for key, transactional keywords. When 93% of your customers won’t go past the first page of Google, your absence or lack of targeting for essential keywords will cost you conversions. For brands within a space that may consider themselves more of a luxury or treat item, such as luxury kitchen and cookware, they may find that their organic traffic naturally starts shrinking, in line with a reduced consumer interest during the cost-of-living crisis.
Two brands reported a drop in organic traffic on desktop, with Tefal receiving the biggest loss (-8%). On mobile, 4 brands received a drop in organic traffic, with Salter reporting the biggest drop on this device (-13%). Low or inconsistent organic traffic on both mobile and desktop is often perceived negatively by website visitors because it can signal a lack of relevance or authority. When a website is difficult to find through search engines, users may assume it is less trustworthy or not widely recognised.
Universal Search Opportunity
Google Universal Search Results is an evolving opportunity to make your pages visible on a SERP (Search Engine Results Page). Universal results often appear before traditional listings and are eye-catching for users. Universal search results refer to rankings on a SERP that are not the traditional ‘blue line’ Google link, and a brand can appear for universal search results without being strong in standard rankings. 'Image' and 'review' results would be particularly useful for kitchen and cookware brands, who would be able to show their products to users without them visiting their site and build trust in their products by encouraging customer reviews.
ProCook continues to secure the most Universal Search appearances (10,765) — an increase from 10,732 previously. The majority of their appearances came from ‘images’ (9,200).
The Longtail Keyword Opportunity
Longtail keywords are often considered high intent and potentially more likely to convert as a searcher is being more specific. Optimising for longtail keywords also puts your content strategy in a strong position to rank for brand-new search terms as they enter Google’s index. Kitchen and cookware brands should be optimising for longtail keywords that show high purchase intent - though they may not score highly in terms of search volume or traffic, these keywords will pay off as being more likely to secure purchases.
ProCook continues to secure the most longtail keyword appearances for position 3 (4,202) — a decrease from 4,067 previously. ProCook also continues to secure the most appearances for positions 4–10 (4,989) — an increase from 4,189 previously. Longtail keywords can be strategically incorporated into high-quality content that directly answers user needs. Blog posts, guides, FAQs, and how-to articles are particularly well suited to longtail optimisation. When content closely matches a user’s query, it increases the likelihood of higher engagement and longer time spent on the page.
Facebook Adverts
With the number of Facebook users in the United Kingdom (UK) hitting over 44 million users in 2023, it is not surprising that companies have jumped at the opportunity to advertise on the social media platform. Facebook’s UK digital advertising revenue has been estimated to have breached 2.6b GB pounds in 2019.
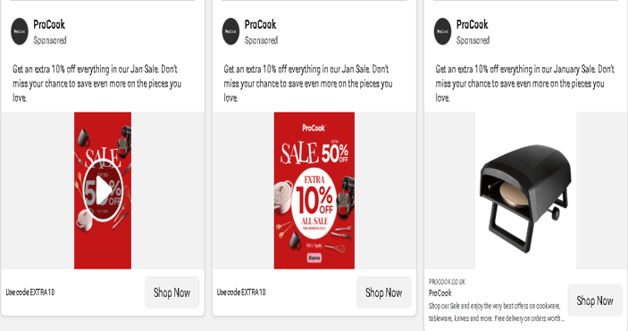
We’ve included screenshots of ProCook’s sponsored Facebook posts. This UK kitchen and cookware brand used social media to showcase their latest deals — a great way to entice traffic to their website.
Top Social Shares & Content
When it comes to social media and on-site content strategies, it is important to release content that has a longer shelf life. An article is considered 'Evergreen' if it has maintained its relevancy to an audience for longer. It's great for your brand engagement, but great for Google too, who will recognise content which achieves traffic over a long period of time. Kitchen and cookware brands can bridge across both food-focussed recipe content, along with interior design and lifestyle pieces.
Tefal secured the most Facebook Likes (4.1m), and Our Place secured the most Instagram followers (941,000). Facebook was the most popular social media platforms of all brands. Our Place received the highest total engagement rate (6,213) and the highest average engagement (887).
Website Readability & Accessibility
20% of people in the UK have a disability – 2 million of which are people living with sight loss. In addition, 1 in 12 men and 1 in 200 women have some degree of colour vision deficiency. When websites are not designed to meet these needs, brands lose customer interest as they turn elsewhere. Though the temptation may be there for luxury brands to choose style over function, they must not underestimate the impact of making their site accessible for all potential customers.
In our previous report, Circulon flagged the most accessibility alerts (244). This quarter, Circulon remains the brand to watch, but they’ve since decreased their accessibility alerts to 223 — demonstrating they’re aware of the seriousness of these alerts. For users who rely on assistive technologies, accessibility alerts can be a direct barrier to accessing content. Screen readers, keyboard navigation, and other tools may not function as expected when accessibility issues are present. As a result, visitors may feel that the website was not designed with their needs in mind.
GET THE FULL 70-PAGE Q1 2026 REPORT
To get a copy of the full report, please complete the enquiry form. If you want to talk to us about accelerating your digital performance, please call us on 01543 410014 or schedule a call with Rory Tarplee.