Do you want to create an infographic but don’t know where to start? Read on as Charlotte Howell reveals her top tips and considerations for producing an inspiring infographic.
Infographics or information graphics are a captivating way to present or explain, complex facts or figures, quickly and effectively. What makes infographics truly effective is their digestible and shareable nature. People remember 80% of what they see and do1. So let the data do the talking for you, and let’s discuss the steps you need to take when creating an infographic.
1. Unearth An Awesome Idea
Thinking up the idea for the infographic you want to create right at the start will make sourcing the content for it far easier. It will help you to visualise the exact snippets of information you need.
A few of my favourite infographic ideas are styled on:
- Lists – People like lists. Lists help to deliver small bites of information quickly, so we don’t have to slow down to process the data.
- How-to guides and processes – How-to guides make great shareable content and are perfect for increasing brand awareness. People are always trying to learn new things, if you create an infographic that teaches them something they’re likely to recommend it by sharing on social media. And we all know how powerful social media can be for reaching out to fresh audiences on new platforms. Some of the audience your how-to infographic reaches may not have even been familiar with your brand previously.
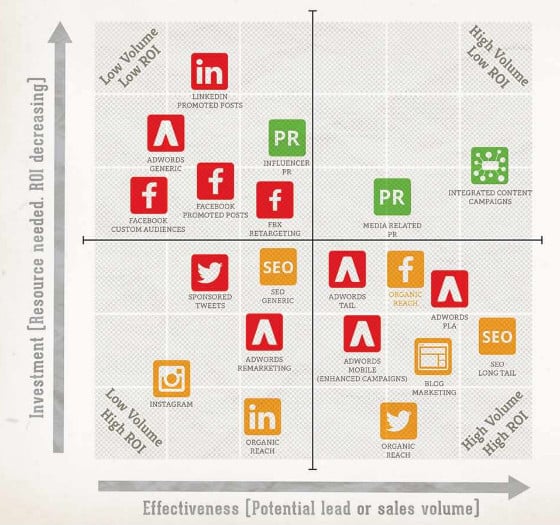
- Comparisons – Do you want to show how your products or services differ from your competitors? Comparison infographics are an impactful way to show why you have a competitive advantage.
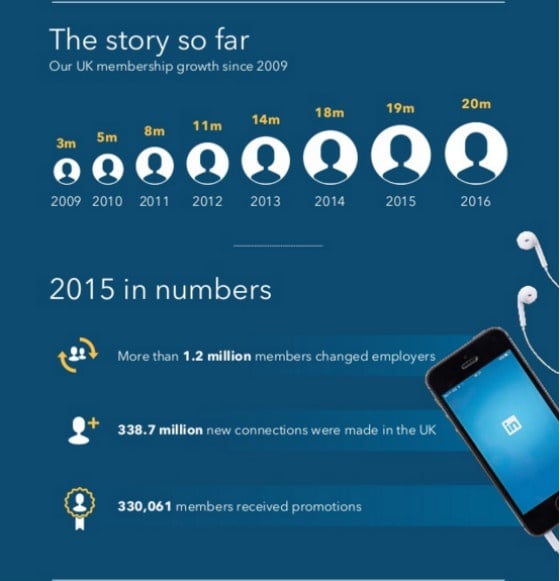
- Timelines and journeys – Display the lifecycle of your product from its first invention to the product in the current day, or show a customer the journey they need to take when using your service.
- Decision tree – Do you often have customers come to you who are unsure of the right product or service for their needs? Let them discover the product to meet their requirements with a decision tree infographic.
- FAQs – Are there some common questions or problems your customers ask you? Why not package your answers and solutions into an easily shareable form?
If you’re unsure of what topic to base your infographic on take a look at your website analytics. Are there any blog posts which are particularly popular or receive a high number of social shares? Developing an infographic around an idea you’ve previously produced content on can help to give that content a new lease of life.
2. Organise and Structure Your Content
When creating an infographic it’s vital that your content is clear and concise. The information you provide should be factually correct and interesting for the intended audience. The main goal of an infographic is to provide digestible points of information. With this in mind, you should avoid using every detail of information you have on a topic.
When structuring your infographic it should have a narrative. Structure your infographic so it’s easy to understand and straightforward for the user to follow.
What truly makes an inspiring infographic? A great title. The title is likely to be the element which hooks users in. It needs to be short and succinct to grab their attention and generate awareness.
3. Be Daring With Your Design
When putting together a design for an infographic try to use elements in the design that will help people to better visualise the data you’re sharing. Use shapes, icons and graphs. Colour visuals increase the willingness to read by 80%2 so replace words with icons and symbols where possible.
When it comes to design dare to be different by exploring innovative visuals. But remember, it’s important that the style you choose reflects the topic of the infographic. And if you have brand guidelines it’s important to consider the limitations these may have on your design.
Sources
- Lester, P. M. (2006). Syntactic Theory of Visual Communication
- Green, R. (1989). The Persuasive Properties of Color, Marketing Communications