.png)
-1.png?width=1408&height=1031&name=Footwear%20-%20COVER%20(1)-1.png)
The Q1 2026 benchmarking report for UK footwear brands has just been published. Learn how the top 12 UK footwear brands perform across the digital space.
The Q1 2026 benchmarking report for UK Footwear brands has just been published. It covers the largest 12 footwear brands trading in the UK, including Schuh, Kurt Geiger, Pavers, Clarks, Foot Locker, Dune, Office, Foot Asylum, Shoe Zone, Size?, Timberland, and Sports Shoes.
.png?width=624&height=253&name=Footwear%20-%20LOGOS%20(1).png)
The research gives an inside track on who is winning the biggest share of voice online, and quantifies the gaps, risks and missed opportunities for other footwear brands to win brand exposure, drive online orders, and even encourage in-store footfall. The report highlights quick wins that will improve enquiries from your online strategy and identifies the barriers that may be reducing your site’s ability to optimise digital performance.
To see a preview and contents page of the Q1 report, click here. To get a copy of the full report and the key takeaways, please complete the enquiry form or schedule a call. .png?width=756&height=604&name=Footwear%20-%20COVER%20(1).png)
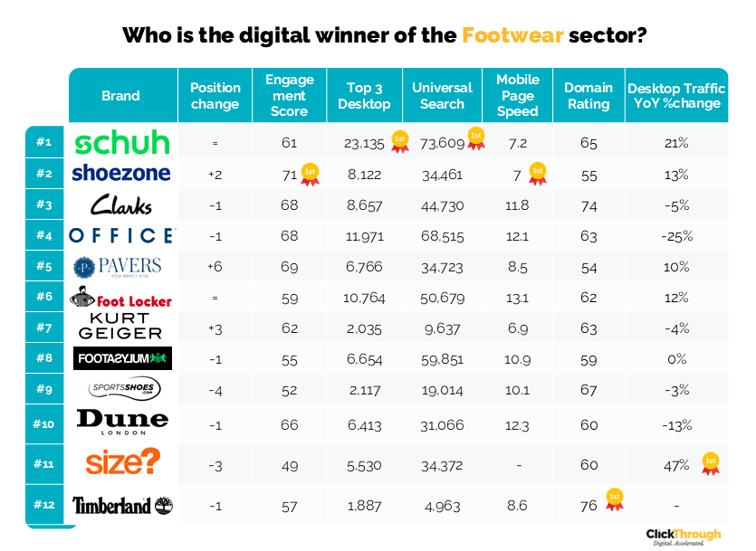
Q1 2026 WINNERS LEADERBOARD
For a glance into just 6 of the metrics, we evaluated these top 12 footwear brands on, check out our quick-look table below;
To understand what the *CTM Digital Performance Index™ is click here.
Continue reading for further detail on this quarter's best and poorest-performing UK footwear brands or request a copy of the report for the full review.
What The Industry Research Report Covers
The 70+ pages of research benchmarks each site based on 50+ metrics and indicators of successful digital strategy, including organic visibility, domain authority, paid media ads, conversion performance, technical performance, site speed, universal search, content, social ads, accessibility, and mobile performance.
Driving Optimal ROAS from Paid Media Channels
Some of the leading players in the space are high spenders on paid media channels such as Google, Bing & Facebook - but have a poor or sub-optimal conversion improvement strategy. Without an optimised, sophisticated conversion strategy that maximises the conversion rate, the return on investment is unsustainable or will under-perform. Scaling spend on paid media is not achievable unless the conversion rate delivers optimal performance in the sector. Some in the space have paid media spend levels from 30k+ per month but dedicate minimal resources and budgets to conversion testing. Given the cost per clicks on ad networks will continue to rise, we recommend spending at least 10% of your paid media budget on ongoing conversion optimisation testing schedules to ensure your paid media ROI maintains long-term viability, competitive advantage, and sustainability.
Pay-Per-Click Marketing
Pay-Per-Click marketing is constantly evolving, with more and more advertisers being forced to hand over a lot of control to Google's algorithms as the push for automation grows ever stronger. There are still key elements of control that we have though, the main one of these being budget which is ultimately something the algorithms can't take from you. That's why being smart with your budget and ad coverage is essential to achieving strong results and bettering what your competitors have to offer.
For Q1 2026, the average monthly budget wastage across these UK footwear brands was £42,136 with some of the top players in the market spending a considerable amount on areas and audiences unlikely to deliver a return. We can see this in more detail when looking at the average monthly cost per cost-per-click (CPC) amongst advertisers, with the average of this metric being £3. This highlights how competitive the market is and how important it is to control your budgets effectively.
There are varying monthly ad budgets across the competitors in the report. While this gap highlights the competitive advantage that larger budgets can provide, it's not just about spending more; it’s about spending smarter. By focusing on driving efficiency in campaign management, targeting, and budget allocation, businesses with smaller budgets can still effectively compete with larger players. Investing in data-driven strategies and refining ad performance can help close the gap and maximise the return on every pound spent, enabling growth even in a competitive landscape. Relative to their spend, Size, Foot Asylum, and Sports Shoes reported the lowest monthly cost-per-click (CPC) at £1, and Clarks reported has the highest at £6.
The report highlights the importance of budget efficiency by comparing monthly ad spend with estimated CPC in relation to your competitors, see who has the highest and lowest CPC. To maximise the effectiveness of your budget, it’s essential to focus on driving CPC down while maintaining or improving campaign performance. In this report, Dune has the lowest estimate monthly ad spend at £298, and Foot Locker has the highest at £618,000.
By optimising targeting, refining ad copy, and leveraging data to identify high-converting opportunities, you can ensure every click delivers maximum value. This approach not only stretches your budget further but also boosts your return on ad spend (ROAS), enabling you to achieve stronger results without simply increasing expenditure.
Technical Website Compliance
Savvy digital marketers know that having a technically sound website is an essential component of a successful fully integrated digital strategy - plus a site capable of maximising conversion performance. For brands in e-commerce sectors, like shoes and footwear, they'll need to ensure they're staying ontop of ever-changing product lines and properly maintaining their internal linking structure when pages are removed.
In our previous audit, Schuh received the most 404 errors (690). This quarter, Schuh has dramatically made improvements to decrease their 404 errors to 3. Currently, the footwear brand with the most 404 errors is Dune (605). Mobile users are particularly sensitive to interruptions such as 404 errors. When browsing on a smartphone, users often expect quick and seamless navigation. Encountering a broken page can quickly discourage them, causing them to exit the website and increasing the overall bounce rate.
Site Speed & Conversion Rate Performance
When 62% of consumers are less likely to convert if they have a negative mobile site experience, ensuring that your site is quick and easy to load makes a significant improvement on your overall conversion rates. For retail sites, they'll want to ensure they're providing a quick and simple shopping experience that encourages purchases.
In our last audit, Foot Asylum reported the slowest mobile site speed (2). This quarter, Foot Asylum remains at the bottom of the leaderboard, though they’ve since slightly increased their mobile site speed to 4. Mobile users often rely on varying internet connections, such as mobile data or public Wi-Fi. These connections can be slower or less stable than home broadband used on desktop computers. Ensuring a website loads quickly on mobile devices helps provide a smoother experience for users regardless of their connection quality.
Building Competitive Advantage with Domain Authority
Domain authority is an essential metric for measuring the effectiveness of SEO performance, and helps create a reliable overall gauge of how effective your site is at achieving organic traffic, i.e. ‘free’ traffic that isn’t gained through sponsored ads. Footwear brands can collaborate with bloggers and online publications within the fashion sector to grow their backlink profile and boost their authority
A ‘good’ DA really comes down to how your competitors are performing, however it’s generally considered average between 40 and 50, good between 50 and 60, and excellent above 60. In our previous report, Pavers received the lowest DA score (51). This quarter, Pavers remains the brand to watch, though they’ve since made improvements (54). Improving user experience can indirectly support domain authority growth. When visitors find a website easy to navigate and valuable to use, they are more likely to stay longer, share the content, or link to it from their own websites.
Organic Performance – Mobile & Desktop
A strong organic performance is strategically important as it ensures your site ranks above competitors for key, transactional keywords. When 93% of your customers won’t go past the first page of Google, your absence or lack of targeting for essential keywords will cost you conversions. We've found that many sectors are seeing overall reductions in traffic, with potential customers feeling the squeeze of the cost of living crisis. This is particularly true in sectors considered 'treats', such as footwear.
Five brands reported a drop in organic traffic on desktop, with Office flagging the biggest loss (-25%). On mobile, three brands reported a decrease in organic traffic, with Office seeing the biggest drop (-19%). Cookies, browser settings, and privacy features can vary between devices, which may influence how sessions and visits are recorded in analytics platforms. While the underlying traffic may be similar, these technical differences can still create noticeable variations in reported organic traffic between mobile and desktop users.
Universal Search Opportunity
Google Universal Search Results is an evolving opportunity to make your pages visible on a SERP (Search Engine Results Page). Universal results often appear before traditional listings and are eye-catching for users. Universal search results refer to rankings on a SERP that are not the traditional ‘blue line’ Google link, and a site can appear for universal search results without being strong in standard rankings. 'Image Pack' is a great way for footwear brands to secure interest in their products directly from the SERP, without needing to tempt users to their site through copy alone.
Schuh has since secured the most Universal Search appearances (73,609) — overtaking Office (currently in second place with 68,515 appearances). The majority of Schuh’s appearances came from ‘images’ (68,300).
The Longtail Keyword Opportunity
Longtail keywords are often considered high intent and potentially more likely to convert as a searcher is being more specific. Optimising for longtail keywords also puts your content strategy in a strong position to rank for brand new search terms as they enter Google’s index. For footwear brands, high-intent terms could look like 'mens white puma trainers size 9', as this user has a clear idea of what they're looking for, and want their size to be available.
Schuh secured the most longtail keyword appearances for position 3 (18,159) — a decrease from 19,413 previously. Schuh secured the most longtail keyword appearances for position 4–10 (26,706) — an increase from 27,235 previously. Creating dedicated pages or articles for recurring long-tail queries—such as how-to questions or comparisons—helps websites capture niche search traffic consistently. This approach positions the site as a helpful resource and encourages repeat visits.
Facebook Adverts
With the number of Facebook users in the United Kingdom (UK) hitting over 44 million users in 2023, it is not surprising that companies have jumped at the opportunity to advertise on the social media platform. Facebook’s UK digital advertising revenue has been estimated to have breached 2.6b GB pounds in 2019. For footwear brands, Facebook ads are a great way to ensure topical content such as sales, trends, or limited edition collections, get visibility quickly, and are seen by the right audiences.
We’ve included screenshots of Foot Locker’s sponsored Facebook posts. This UK footwear brand should consider creating some custom imagery for their Facebook posts to make them look more enticing to social media users.
.png?width=602&height=329&name=Footwear%20-%20Facebook%20(1).png)
Top Social Shares & Content
When it comes to social media and on-site content strategies, it is important to release content that has a longer shelf life. An article is considered 'Evergreen' if it has maintained its relevancy to an audience for longer. It's great for your brand engagement, but great for Google too, who will recognise content which achieves traffic over a long period of time.
Timberland secured the most Facebook Likes (8.8m) and the most Instagram followers (3.3m). Facebook was the most popular social media platforms of all brands. Foot Locker received the highest total engagement rate (50,735), and Office secured the highest average engagement (179).
Website Readability & Accessibility
20% of people in the UK have a disability – 2 million of which are people living with sight loss. In addition, 1 in 12 men and 1 in 200 women have some degree of colour vision deficiency. When websites are not designed to meet these needs, brands lose customer interest as they turn elsewhere. As with site speed, brands within the footwear and wider fashion sector can often favour style over function, leading to errors. In the case of accessibility, they risk not just inconveniencing users, but alienating one demographic altogether.
In our last audit, Shoe Zone reported the most accessibility alerts (637). This quarter, Shoe Zone continues to report the most accessibility alerts, though they’ve since decreased their total to 611, suggesting they’re aware of the implications these alerts can have. Making all interactive elements keyboard accessible ensures users can navigate without a mouse or touchscreen. Eliminating keyboard traps and unreachable controls reduces alerts and supports people with motor impairments.
GET THE FULL 70-PAGE Q1 2026 REPORT
To get a copy of the full report, please complete the enquiry form. If you want to talk to us about accelerating your digital performance, please call us on 01543 410014 or schedule a call with Rory Tarplee.