


Wondering where to find bounce rate in GA4, and what the measurement’s changes mean? Our latest blog compares bounce rate versus engagement rate in GA4.
What’s new in GA4? How to compare bounce and engagement rate
One of the many big changes between universal analytics and GA4, is the move from bounce rate to engagement rate. Google Analytics 4 works on the basis of measuring events and engagement with your site, moving away from high-level metrics in favour of those that give in-depth information on user behaviour.
Initially, it was thought that the bounce rate was not going to be brought into GA4. It was assumed by many that Engagement Rate had taken this over, as this is the metric that most prominently features in the default GA4 reporting templates. However, this is not the case, and you can now see both metrics from within your GA4 account.
Has bounce rate changed in Google Analytics 4?
If you’re familiar with using bounce rate in Universal Analytics, you will know a bounced user as being a user who leaves a page having had no interaction with it. For example, a user may visit a page, spend several minutes reading the content or referring to information, but leave without clicking on any further links. This would class them as a bounced session.
For pages needing to feed users to other parts of their website, bounce rate has always been an appropriate way to measure. However, when your page is informational and doesn’t actually need users to click anywhere to fulfil its purpose, engagement must be measured in an alternate way.
In Google Analytics 4, Bounce Rate is calculated differently, to broaden this field. Bounce Rate is now dependent on ‘Engaged Sessions’. So, what is an engaged session?
An engaged session has had one of the below:
- a session lasting longer than 10 seconds or,
- a session that triggers an event or,
- a session that includes at least 2 page or screen views.
You can see from this that the scope for Bounce Rate is much broader, making this a more universally applicable metric. This is also how Engagement Rate is calculated.
What is the difference between bounce rate and engagement rate?
GA4’s Bounce Rate and Engagement Rate are both calculated from engaged sessions, but are the inverse of one another.
What is bounce rate in GA4?
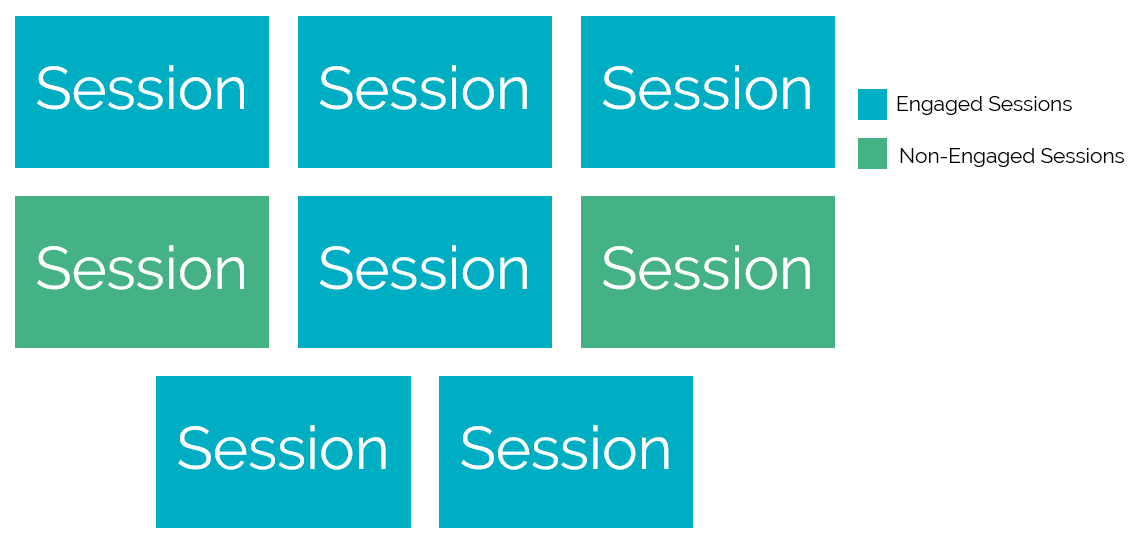
This is taken from the percentage of non-engaged sessions. So, these would be people who stayed for less than 10 seconds, did not trigger an event, and did not visit any other pages. In the below image you can see that, out of 8 sessions, 2 of these weren’t engaged, this would give us a bounce rate of 25%
What is engagement rate in GA4?
The Engagement rate is currently visible in most reports, as this is GA4’s default way of measuring events. The only difference between bounce and engagement rate is that engagement rate is measured in the positive.
Looking again at the image above, instead of focusing on the non-engaged sessions in green, we’re focusing on the engaged sessions, in blue. So, out of 8 sessions, 6 were engaged, therefore making the engagement rate 75%.
How to check Bounce Rate in GA4
We understand that, for some users, bounce rate is a relevant metric that may be key to your legacy reporting setups. For this reason, it’s important you know how you can pull bounce rate into your GA4 reports. However, you must be mindful that Bounce Rate is not measured the same as in Universal Analytics, so don’t be surprised when you see huge improvements year on year!
So how do you pull the Bounce Rate into the GA4 interface? You can do this in two ways, first by customising your reports or, secondly, by creating an Explorer Report.
How to add Bounce Rate to your interface reports
In GA4 go to Reports. You could add Bounce Rate to several reports, but your User or Traffic Acquisition report and your Pages and Screens report may be the most useful starting point.
- Go to either; Reports > Acquisition > User or Traffic acquisition or Reports > Engagement > Pages and Screens
- In both these reports, there is a pen in the top right-hand corner - click this. Once selected it will allow you to customise the report.
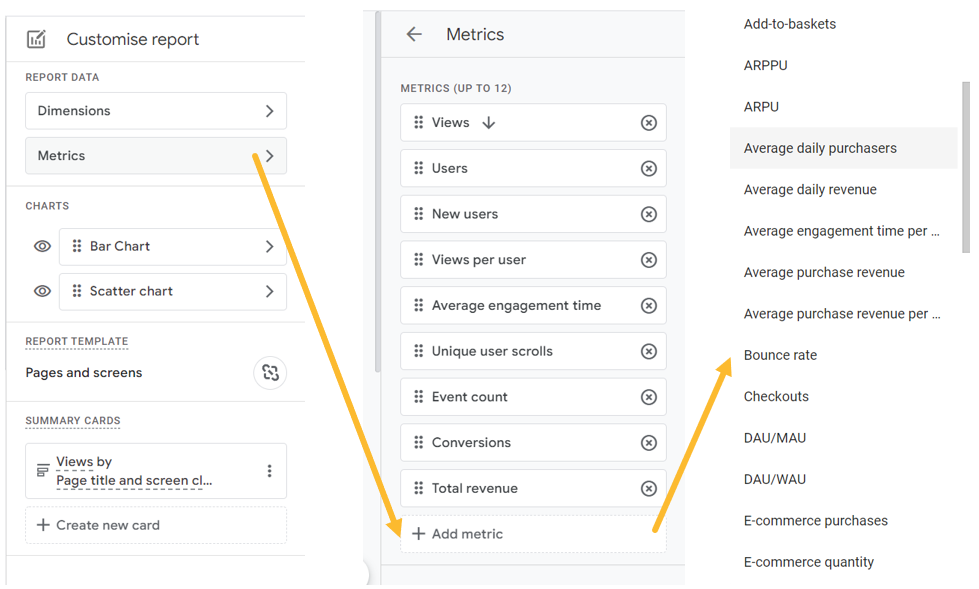
- Select ‘Metrics’. This will give the current report metrics and the option to add a metric at the end of the list.
- Select 'Bounce Rate' from the list and click apply, this will then add it to your metrics list (you can amend where the bounce rate is viewed by clicking the 6 dots next to bounce rate and dragging it up the list) and click apply again. This then adds bounce rate to your report.
In the right-hand corner, you will see a blue button where you can save your changes.
How to add Bounce Rate to an explorer report
You can also view Bounce Rate in GA4 by adding it to an explorer report, using the steps below.
1. Create a new explorer report within your reporting tab.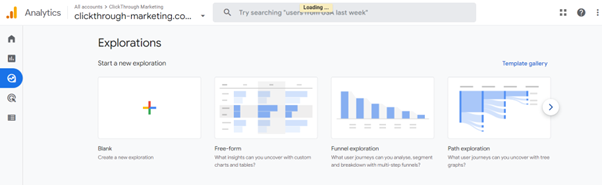
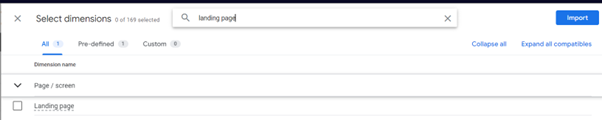
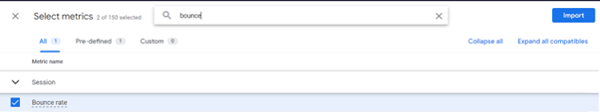
2. Select the + next to 'Dimensions' and choose 'Landing Page' and then Import.
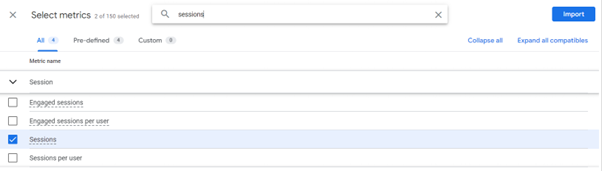
3. Select the + next to metrics and choose 'Bounce Rate' and 'Sessions' and then import.
4. Drag 'Landing Page' to Rows in tab settings and 'Sessions' and 'Bounce Rate' into 'Values'. You should then see a table like this.
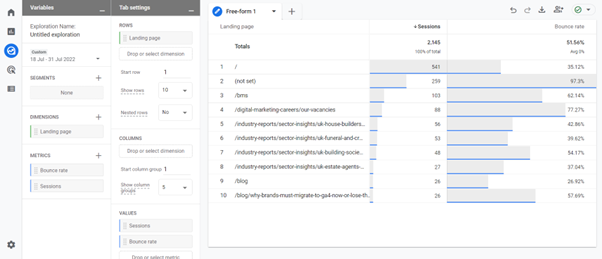
You can then access this report as and when you need to view Bounce Rate on your key pages.
Need support in setting up on Google Analytics 4? We’ve created a free quick guide to getting set up on Google Analytics 4. Download your free copy now or talk to our experts to get more in-depth advice on making the most out of Google Analytics 4.


Let's be social
Join our growing social communities to learn more about the benefits of digital marketing and the people who make us tick.