


What is the best way to grow your market share? From search gap analysis to website performance, read more from Dr Dave Chaffey in his latest blog article.
Growing your market share by benchmarking your search effectiveness
In many industries, consumer search intent has increased dramatically as online commerce has grown during the pandemic. This means that it’s now more important than ever to benchmark your search effectiveness to make sure you’re tapping into this increased demand. In this article, I’ll share some new research that relates the share of searches for your business to market share in your sector, which can help make the case for investment in search marketing.
I’ll also outline the process, tools and reports that we use at Clickthrough Marketing to compare competitors in a sector to identify opportunities to grow market share through integrating organic and paid search marketing activities. I’ll be looking at examples from the fashion retail sector, focusing on organic search. We also have benchmarking reports for many other retail sectors.
Comparing your share of searches to market share
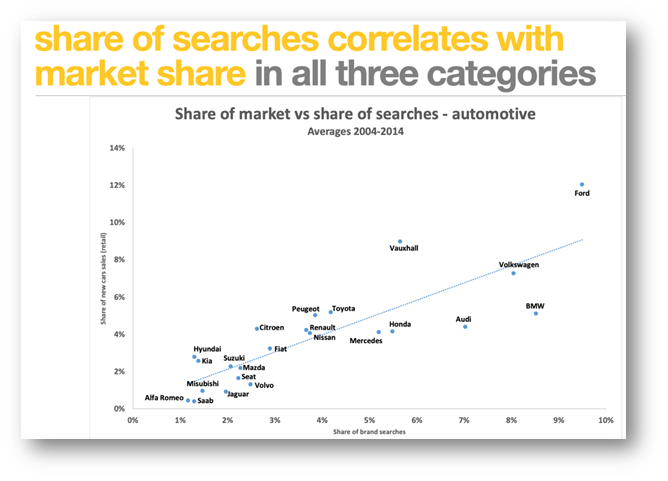
This recent research was presented by Les Binet, Head of Effectiveness at agency adam&eveDDB, at a recent IPA effectiveness week presentation titled ‘A new way to track brands and advertising‘.
Les and team have reviewed historic data of search and purchase behaviour in three different markets (automotive, energy and phones). This automotive example shows that, as you might expect, there is a correlation between share of searches and market share. Simply put, more people will search for brands which have better awareness and sales. This chart shows the correlation for car brands in the UK. It has dated data to protect client confidentiality.
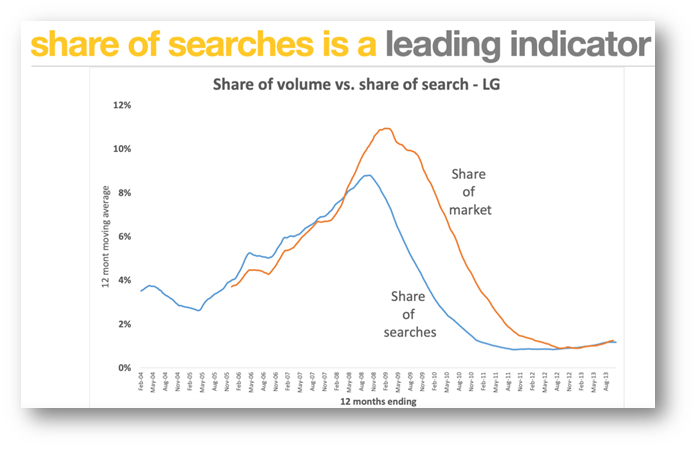
Of course, ‘correlation doesn’t prove causation’ and this isn’t unexpected. But the research goes on to assess the relationship through time between share of searches and market share. You can see in this chart for the appliances brand LG that share of searches acts as a leading indicator for share of market. When share of searches falls due to competitor action or changes in marketing investment, both search volume and market share fall.
Benchmarking organic search effectiveness in the fashion sector
For me, more detailed search benchmarking has two main goals. First, we can compare relative performance – i.e., results delivered compared to competitors. In retail these are likely to be direct competitors, but in other sectors, competitors on Google page one may be other types of businesses, like publishers rather than brands and manufacturers, so one mistake to avoid is to not limit your comparison to direct competitors - do the evaluation across all marketplace players who are delivering results for your target keywords.
Comparing the reach and visibility for target keywords will help you demonstrate to others the opportunity to grow leads and sales through organic search, if you’re following the right best practices and optimising your approach to stay competitive. Second, benchmarking should reveal the success factors or performance drivers for organic and paid search. This will give you practical insights that you can set targets for and then work with your agency to improve and report back on progress. Let’s take a look at some of the reports and tools we recommend, focusing on Google.
I’ll now drill down to share some of the reports and tools we use.
Share of search reports
We compare share of search by identifying target keywords consumers use in their searches based on the common product categories offered by a set of competitors.
This analysis from BrightEdge shows the number of a defined set of keywords for four brands from the fashion industry (names removed to protect confidentiality) rank for within Google.
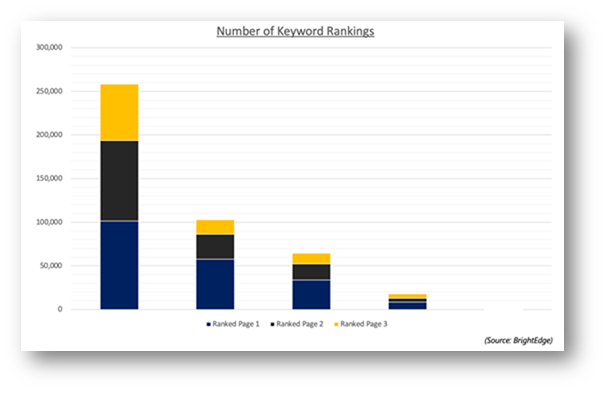
Considering page 1, which is the most important to performance, we see a large difference between the four brands, with a clear leader with around three times the number of page 1 keyword rankings. This is a great position to be in, but it shows the opportunity for the other companies to gain market share. For clients, we break this down further to consider position groups within page 1.
Search gap analysis
Search gap analysis is a technique I have advocated for, for 10+ years, and ClickThrough have long used as part of our in-depth SEO analysis. It’s powerful since it’s based on comparing potential and actual number of visits to identify opportunity to drive more site visits. The technique integrates consumer search intent from Google or other sources showing potential search volume, and then compares it to actual search volume, from Google Search Console, to identify areas where there is good visibility based on visits shown in green against opportunities.
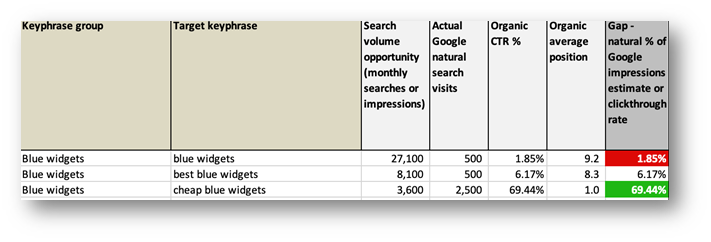
We recommend grouping keywords into meaningful groups as shown. Google Ads data can also be integrated, but only organic data is shown here.
Backlink analysis
To help exploit the potential shown by share of search and gap analysis, more detailed on-page analysis is needed for which pages are driving specific keywords based on their content. Also vital is an evaluation of the relative authority of sites based on the number and quality of backlinks from other sites.
This analysis from Ahrefs compares total backlinks and referring domains.
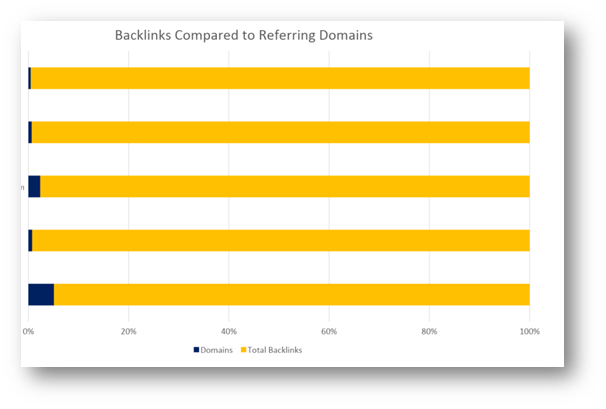
Generally, we find that it is the number of unique referring domains which is most predictive of search rankings and visits, so it’s useful to set goals to grow the number of unique referring domains for different topics. Many other factors are used to review backlink profiles.
Website Performance
With Google’s announcement that page experience signals will be used in rankings, it’s going to be even more important to benchmark website load speeds and compare them for specific web core vitals that Google analyses. Of course, this is driven by a majority of online content consumption on smartphone and Google’s desire to offer a mobile-first experience.
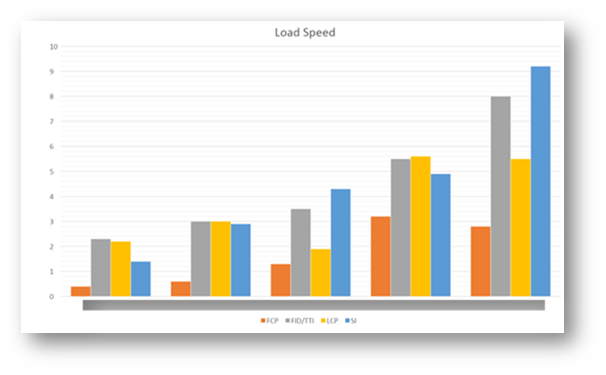
This technical analysis of the four signals that Google will use within its ranking shows large differences between competitors. The two slowest sites may well receive warnings already within Google Search Console, suggesting a potential issue that needs to be addressed.
Google Ads
We also use a range of analysis techniques to compare paid search effectiveness in Google and Bing. To take one example, exact match spend is a good indicator of a well optimized paid search campaign. As your campaign matures, you should be moving terms from broad and phrase match onto exact match to help reduce wasted budget.
The pie chart below depicts the share of exact match spend for each domain.
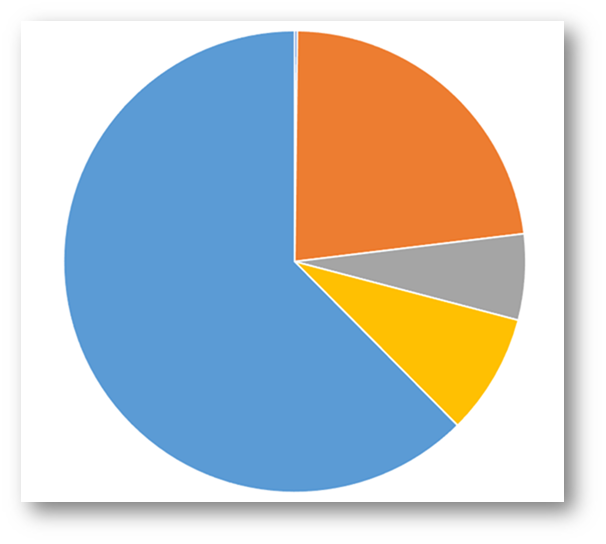
Again, there are large differences between competitors. Of course, more detailed analysis is needed, but it can be useful to overlay data on known revenue for the domain.
Conclusion
We have reviewed several different types of benchmarking analysis techniques. You can see that we use a range of tools, rather than a single analysis tool that covers many applications but doesn’t always give the best analysis. This is a benefit of working with an agency that has the economy of scale to invest in best of breed tools. So, when selecting a new agency, you should ask for examples of the benchmarking reports and tools used both for initial brand and market discovery and regular performance reporting.
Our benchmarking reports feature brands from many different sectors, so do get in touch to see which the best fit is to your sector or to request a fast-track digital performance evaluation.


Let's be social
Join our growing social communities to learn more about the benefits of digital marketing and the people who make us tick.